Users of the Standard, Pro, and Ultima software versions can view analytical graphs on the main metrics for promoting the doctor's page on the portalProDoctorov.
Where to view analytics 
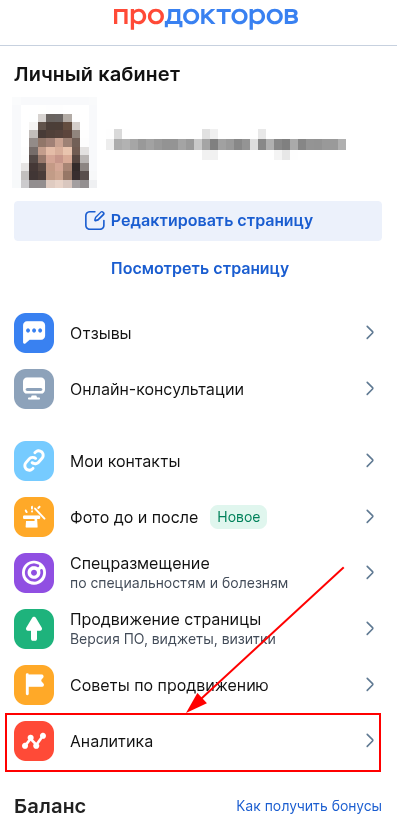
In the doctor's personal office, go to the tab «Аналитика»located above the section«Баланс».
In the tab, you can view graphs for the following indicators:
- Doctor's page views.
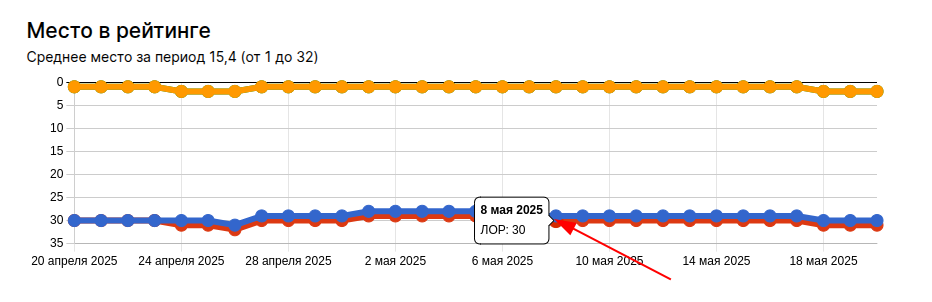
- A place in the ranking.
- The doctor's rating.
- Make an appointment with a doctor.
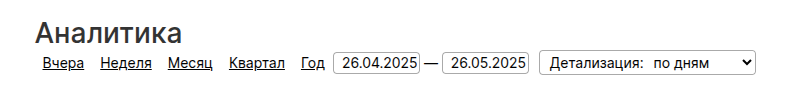
Analytics Filters
At the top of the page there are filters applied for all indicators. These filters allow you to select the reference period for displaying analytical graphs, as well as one of the suggested options for detailing the graph. You can choose to display one of the suggested periods or enter the start and end time of the countdown yourself.
The graph «Место в рейтинге»shows the history of changes in the ranking for all specified specialties of the doctor. When you hover the mouse cursor over one of the points on the graph line, a prompt will appear with the name of the specialty, the date of the selected point, and a place in the rating on that date.